As the number of inhaled viruses or aerosol particles that contain the virus increases, the probability of infection increases. As such, we should be paying attention to inhaled dose, or better yet inhaled deposited dose, as a value that we want to reduce for scenarios involving two or more persons in an indoor space.
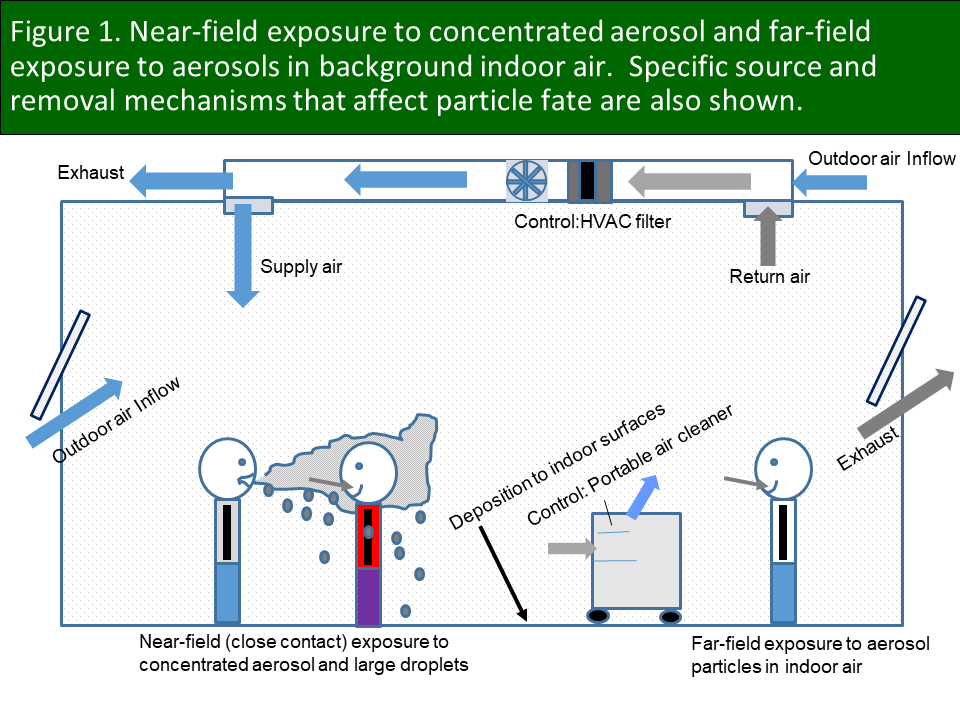
I have been speaking about the importance of inhaled deposited dose for several months. This very important concept seems like an innocent bystander to a lot of discipline-specific angst around semantics involving airborne particles, droplets, aerosols, close contact, etc. If a particle is in the air and you inhale it, it can lead to inhaled deposited dose. I do not care what anyone calls it or where the virus-carrying particle was inhaled. It may have been inhaled while challenged by a concentrated aerosol stream in close contact with an infector (near field) or at a lower concentration in the far field (see Figure 1). If it is inhaled it can deposit in the respiratory system. Period. Your immune system does not care what pathway it took to get there.
Importantly, concentration in air is NOT dose. Exposure is NOT inhaled dose. And more attention should be given to inhaled deposited dose (IDD) of aerosols, which after all are the effective rideshare for SARS-CoV-2 into your respiratory system. Why is IDD important? Because understanding the basic factors that influence IDD provides a roadmap for reducing dose and associated response (risk of infection). Further, once a dose-response relationship is developed we will need to be able to effectively model inhaled dose or inhaled deposited dose to use a dose-response relationship effectively. Such knowledge will help with strategies to prevent infection, as well as appropriate post-outbreak forensics. I have been spending my “free” time on development of emissions-to-IDD models.
What is the inhaled deposited dose? The IDD (Di) is the total number of particles in size range “i” that are inhaled and that deposit in a person’s respiratory system. In mathematical form, it is the product of four variables.
Di = Ci x B x t x fi
It is worth taking a closer look at each of these variables, as understanding the factors that affect these variables yields valuable insights into how to reduce Di, and therefore how to implement effective risk reduction strategies.
The term Di corresponds to the total number of particles in size range i that actually deposit in the respiratory system, from the nose to the deepest recesses of the lungs, i.e., alveolar region. The units are simply number (#), as in number of deposited particles in a specific size range. A specific particle diameter is used to represent the range i and is often taken as the geometric mean of the endpoints of a small size range. For example, if a particle size range is 1 to 1.5 μm, the geometric mean is taken to be the square root of the product of these end points, or (1 x 1.5)0.5 = 1.22 μm. More on how we use this later.
The term Ci is the concentration of particles in size range i in the breathing zone of a susceptible receptor. This is taken to be a particle count in size range i per volume of air, e.g., # of particles per liter or air or #/L. This concentration depends on the number of particles emitted from an infector, which can vary significantly between infectors, by activities for the same infector, e.g., coughing or singing versus breathing while at rest, and as a function of time during infection. The value of Ci can be considerably lower if the infector is wearing a mask, especially in the near field if an infector faces the receptor, and even to some extent in the indoor far field. Further, Ci will be lower if the receptor is also wearing a mask (reduces concentration in breathing zone inside mask).
Greater ventilation reduces Ci, especially in the far field, by replacing indoor air that contains virus-carrying particles with outdoor air. It may also reduce Ci for close contact (near field) by enhanced mixing and dispersion of concentrated aerosol plumes emitted by an infector.
Values of Ci can also be effectively reduced by filtration (central or portable air cleaners). I have tweeted about nuances related to filtration and will not repeat that information here. Others have as well. None of this is new nor is it rocket science.
Finally, we tend to focus on how much time we spend indoors to reduce our exposure. But remember that the amount of time that an infector spends in a space also affects Ci. If an infector walks into a pharmacy and spends 5 minutes there, the time-averaged concentration in the far field associated with their visit will be much lower than if they spend 30 minutes in the pharmacy. Small particles will accumulate in indoor air and, if the infector stays in the environment for a long time, may reach a steady-state concentration in which the rate of emissions equals rate of loss due to ventilation, surface deposition, filtration, etc. When the infector leaves the indoor space the concentration of virus-carrying particles will decrease at a rate defined by these same removal mechanisms. This may be very important for a scenario involving an infector who just left a classroom at the end of a lecture. Students entering the classroom immediately afterward will be exposed to a much higher value of Ci, and thus inhaled dose, than if they had entered an hour later. This is one good reason for leaving an unoccupied class period between each occupied period in a given classroom.
The variable B is the respiratory minute volume and has units of L/min of air inhaled. Its’ variability is often overlooked but can be very important. The average minute volume of an adult typically ranges from 5 to 10 L/min for rest to simple exertion, e.g., driving. But during heavy aerobic exercise, this value can increase to 50 to 60 L/min or more, up to 10 x or higher volumetric flow rate than what you are likely experiencing as you read this. This large range is why I have expressed such concern about gyms that include significant aerobic activity. Heavy breathing can significantly increase both emissions from an infector and inhaled deposited dose. We have heard a lot of concern about the risks of spending time in crowded and poorly-ventilated bars and restaurants, and for good reason. But crowded and poorly-ventilated gyms with those engaged in aerobic exercises might be even worse because of the elevated respiratory minute volume.
The variable “t” is a fairly obvious one and relates to the amount of time that a receptor spends in an indoor far field with an infector or an infector’s residual aerosol (after infector has departed), or in the direct near-field plume of an infector who is breathing, speaking, singing, coughing, etc., in your direction. For consistency with the units of other terms used here, time should have units of minutes (min). Minimizing time in indoor environments other than your own home is important. Do not go if it is not essential. If essential, go and figure out how to get out in the least amount of time.
The variable fi is the fraction of particles of a specific size range that deposit in the respiratory system (no units). Where particles deposit is likely very important. Particles can deposit anywhere from the nose (head region) to the deepest recesses of the lungs (alveolar region) and everywhere in between (largely the tracheobronchial region). Where a particle deposits depend on the mode of breathing (nose versus mouth), particle size, and to some extent the rate of breathing. Different models can account for these differences and can be used to predict particle deposition. Importantly, not all inhaled particles are deposited in the respiratory system and may come right back out during exhalation. For example, only about 45% of 1 μm (1 micron) particles will actually deposit in the respiratory system (mostly in the nose) for nose breathers doing light exercise (Figure 2). That means that 55% comes right back out in exhaled breath.

It is useful to convert the number of particles of various sizes deposited in different parts of the respiratory system into a volume, e.g., Figure 3 for a simulated 75-minute classroom lecture with an infected teacher. Results show the number of particles deposited in three major regions of the respiratory system of each nose-breathing student for different ventilation and control scenarios. The values at the top of each bar correspond to volume of particles deposited. Total particle volume can be approximated by assuming spherical particles and determining the volume of a particle in a size range using the geometric mean value described previously. This volume can be multiplied by the number of deposited particles in that size range to get the total volume of those particles. And the sum of volume over particle sizes yields total volume. If a viral load in number of viruses per mL is known, it may need to be adjusted for evaporation of water from particles when they are released to indoor air (an effective increase in viral load/mL of particles). This adjusted viral load can be corrected for the fraction of viruses that are infectious.

As an example, assume that an IDD calculation leads to an estimate of 20 picoliters (pL), or 10-12 L, of particle volume deposited across all regions of the respiratory system. A viral load of 1011/mL is equal to 1014/L. If 1% of these viruses are actually infectious, the fraction infected is 0.01. This means that 1014/L x 0.01 = 1012/L are infectious viruses. This value can be adjusted based on virus inactivation rates and the time between particle release and inhalation. If we multiply 1012/L by 20 x 10-12 L for volume deposited we get 20 infectious viruses deposited. Of course, this assumes the same viral load across all particle sizes, and it is not clear that this is the case for SARS-CoV-2. However, it is not difficult to adjust the calculation if we someday have size-resolved viral loads and fraction infected.
I hope that this is a helpful blog. I have been developing models of different complexities that use this concept to illustrate how differences in building design and operation, human activities, and emissions affect inhaled deposited dose. The development and release of models have been a very slow process my day job is almost all-consuming. I am hoping to get one of the simpler models out soon with the help of some colleagues who are user-interface gurus.
Stay tuned and please venture back to this site from time to time. I am making a lot of my seminar, webinar, and lecture slides/notes available here, will continue to expand the list of links for other good information sites, will archive these blogs, and more. Please provide an acknowledgment at point of use if you do use any slides or other information from this site. Otherwise no charge.
Be careful out there.
We will get through this, but it will take a lot of patience. Keep your guard up!

Nice article, but completely based on aerogene transmission of the virus, is this indeed the main transmission pathway? And where is the scientific prove of that?
Don’t get me wrong, I think you are at least in the right direction. And it is helpful by finding ways to minimise the risk of infection.
Also, doesn’t air humidity play a role in this? Or does it affect one of the three variables in some way?
LikeLike
Thanks for the comment, Hildo. As I described in the blog entry, this analysis pertains to inhalation exposure, whether it is aerosols in the near field (close contact) or far field (accumulation indoors). In my opinion, the evidence based on systematic experiments, empirical field data, and modeling all point to aerosol transmission as a primary, but not necessarily only, route of transmission. The direct contact and fomite routes likely cause some transmission, although evidence for either is far less robust than for the inhalation pathway (in fact, practically non-existent for these transmission routes).
Your point about humidity is important. Relative humidity impacts the rate of shrinkage of particles when emitted from a respiratory system, rapidly changing the particle size distribution in favor of smaller particles that stay suspended in air much longer than larger particles, particularly at low to mid-range RH. Humidity will also affect the rate of inactivation of SARS-CoV-2. There is some experimental evidence to suggest that at low humidity the activity of the virus will be sustained longer. Research is still needed at higher humidity for SARS-CoV-2. But even at RH of 40-60%, the half-life of the virus is large enough such that not a large amount of inactivation occurs given typical time periods in which particles stay in indoor air before being exhausted to the outdoor environment.
LikeLiked by 2 people
I have some questions about your model on safeairspaces and how I can apply that model to our school buildings in Michigan. Do you have an email I can contact you at. Your research is amazing and we are using it, in part, to make decisions about bringing kids back to schools. Thank you
LikeLike
Hi Steve,
The model in my presentation is intended to show relative risk reductions for different interventions, but as stated in the documentation should not be used under an assumption of a high degree of accuracy (large uncertainty in the actual risk calculation as there is for any model). As currently formulated it is for a single zone that would be most consistent with a portable classroom or a permanent classroom in a building without central air. For centralized systems that serve large numbers of classrooms on the same air handling unit there will be a dilution effect in the classroom with the infector (good for that classroom) with some spread to other classrooms (possibly bad for those classrooms) depending on the degree of recirculation and the types of filters used. We are currently working on a version 2 of the model that will include other zones (sets of classrooms). So, for now I would use the existing model as a “guide” for determining the relative positive impacts of different dose (and risk) reduction strategies. How much can we lower risk if we do A, or A and B, etc. I hope that this helps.
LikeLiked by 1 person
It does help thank you so much. We have centralized systems that we have installed electronic ionization units on and were trying to calculate that with the clean air delivery rate. We will be waiting for your second revision, very helpful information
LikeLike